Do Any Short-Term Day Trading Strategies Actually Work?
By Akash · 12 min read · Published 2026-03-13
The question of whether any short-term day trading strategy can consistently generate profits is one of the most debated topics in finance. To answer it rigorously, this report combines three pillars of evidence: a review of 25 years of academic research spanning multiple countries, a hands-on backtest of six popular strategies across 10 years of S&P 500 (SPY) and Nasdaq-100 (QQQ) data, and an analysis of the structural forces that make day trading so difficult. The findings reveal a nuanced answer: yes, certain systematic strategies — specifically mean reversion approaches — do produce positive returns, but none of the strategies tested came close to beating a simple buy-and-hold approach over the same period. The data overwhelmingly suggests that for the vast majority of people, passive investing remains the superior path.
1. What the Academic Research Says
The Devastating Statistics
Twenty-five years of peer-reviewed research across multiple markets paints a remarkably consistent picture of day trading outcomes:
| Study | Market | Period | Sample Size | Key Finding |
|---|---|---|---|---|
| Barber & Odean (UC Davis) | U.S. equities | 1991–1996 | 66,465 households | Most active traders underperformed by 6.5% annually |
| Barber, Lee, Liu & Odean | Taiwan stock market | 1992–2006 | Entire market (15 years) | Less than 1% reliably earned positive abnormal returns |
| Chague, De-Losso, Giovannetti | Brazilian futures | 2013–2015 | 1,600 traders | 97% of persistent traders lost money; only 1.1% earned above minimum wage |
| Investopedia synthesis | Multiple markets | Various | Multiple studies | Up to 95% of day traders lose money overall |
The Brazilian study is particularly striking because it tracked every individual who began day trading equity index futures over a multi-year period. Of those who persisted for more than 300 trading days, 97% lost money. The tiny minority who did profit earned returns that came with extreme volatility and risk.
The Taiwan study, covering an entire national stock market over 15 years, found that while the top 500 day traders (out of hundreds of thousands) earned impressive returns, the overwhelming majority experienced net losses after transaction costs.
The One Exception: Systematic Strategies
Not all the research is negative. A 2023 study by Zarattini and Aziz, published on SSRN, examined the Opening Range Breakout (ORB) strategy applied to QQQ between 2016 and 2023. Their findings were remarkably positive: the ORB strategy generated a total return of 1,484% compared to 169% for buy-and-hold QQQ, with an annualized alpha of 33% net of commissions. However, this result relied on using TQQQ (a 3x leveraged ETF) and was achieved through a highly systematic, rules-based implementation — not the discretionary trading that most retail participants practice.
The critical distinction in these studies is that the profitable strategies were fully systematic — mechanically executed with zero discretion. This is fundamentally different from how most retail day traders operate.
2. Our Backtest: Six Strategies, 10 Years, Real Data
To move beyond academic literature and test the question empirically, we backtested six well-known short-term trading strategies using 10 years of daily data (March 2016 to March 2026) for both SPY and QQQ.
Strategies Tested
| Strategy | Category | Logic | Holding Period |
|---|---|---|---|
| RSI(2) Mean Reversion | Mean Reversion | Buy when 2-period RSI drops below 10 (price above 200 SMA); sell when RSI exceeds 70 | 1–10 days |
| IBS Mean Reversion | Mean Reversion | Buy when Internal Bar Strength < 0.15 (close near daily low, price above 200 SMA); sell when IBS > 0.85 | 1–5 days |
| 3-Day Low Reversion | Mean Reversion | Buy after 3 consecutive down closes (price above 200 SMA); hold 3 days | 3 days |
| Momentum (3-day) | Momentum | Buy when close exceeds 3-day high; hold 1 day | 1 day |
| Gap Fill | Mean Reversion | Fade gap openings > 0.5%; exit at close | Intraday |
| Opening Range Breakout | Breakout | Buy/short when open exceeds 5-day range; exit at close | Intraday |
Complete Results
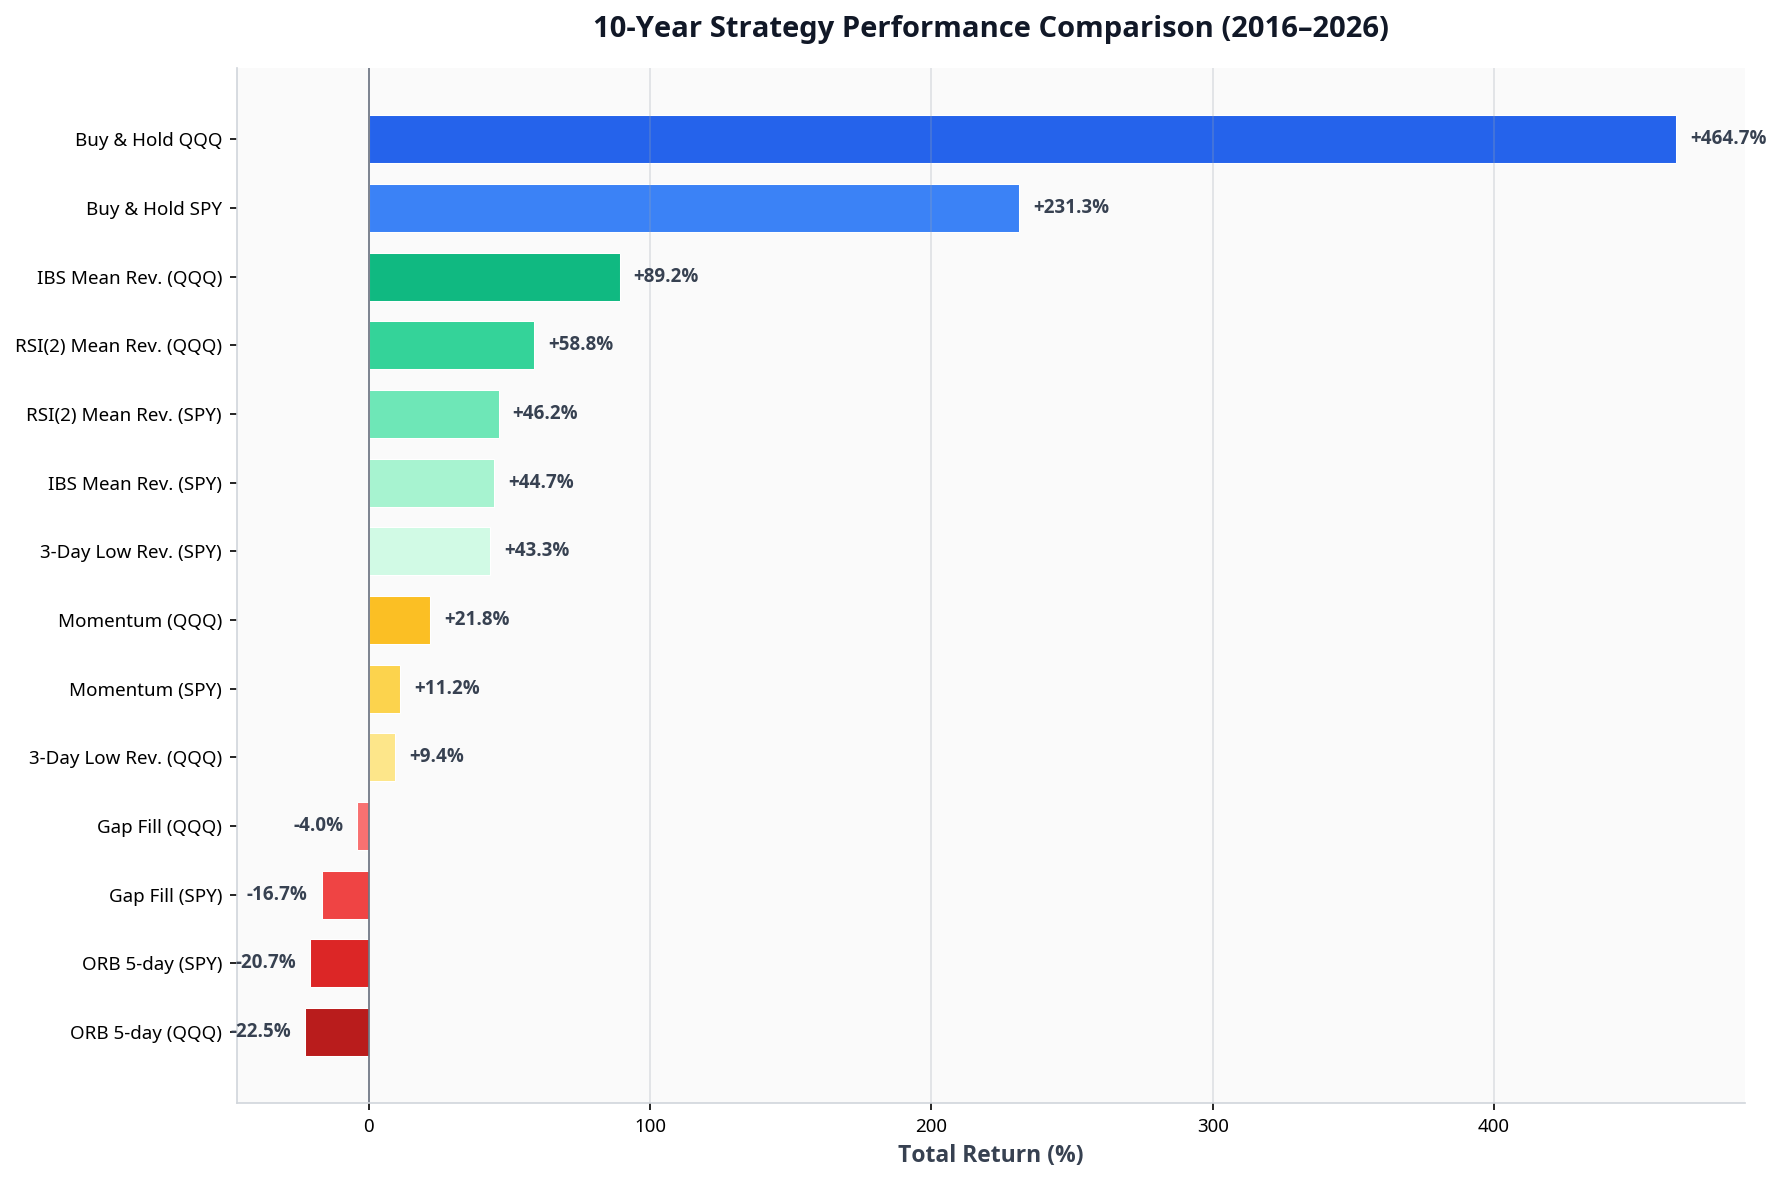
The following table presents the full backtest results, ranked by total return:
| Strategy | Symbol | Trades | Win Rate | Avg PnL/Trade | Total Return | Profit Factor | Max Drawdown |
|---|---|---|---|---|---|---|---|
| IBS Mean Reversion | QQQ | 157 | 69.4% | +0.57% | +89.2% | 2.25 | -9.9% |
| RSI(2) Mean Reversion | QQQ | 188 | 72.3% | +0.31% | +58.8% | 1.61 | -18.4% |
| RSI(2) Mean Reversion | SPY | 204 | 72.1% | +0.23% | +46.2% | 1.60 | -17.6% |
| IBS Mean Reversion | SPY | 153 | 69.9% | +0.29% | +44.7% | 1.69 | -9.4% |
| 3-Day Low Reversion | SPY | 130 | 66.2% | +0.33% | +43.3% | 1.67 | -17.6% |
| Momentum (3-day) | QQQ | 641 | 57.7% | +0.03% | +21.8% | 1.10 | -25.6% |
| Momentum (3-day) | SPY | 615 | 52.5% | +0.02% | +11.2% | 1.07 | -22.0% |
| 3-Day Low Reversion | QQQ | 120 | 59.2% | +0.08% | +9.4% | 1.09 | -39.1% |
| Gap Fill | QQQ | 960 | 48.5% | -0.004% | -4.0% | 0.99 | -54.9% |
| Gap Fill | SPY | 709 | 45.0% | -0.02% | -16.7% | 0.94 | -58.2% |
| ORB (5-day) | SPY | 511 | 51.3% | -0.04% | -20.7% | 0.86 | -33.9% |
| ORB (5-day) | QQQ | 499 | 50.1% | -0.05% | -22.5% | 0.88 | -33.3% |
| Buy & Hold | SPY | 1 | N/A | N/A | +231.3% | N/A | N/A |
| Buy & Hold | QQQ | 1 | N/A | N/A | +464.7% | N/A | N/A |
Key Observations
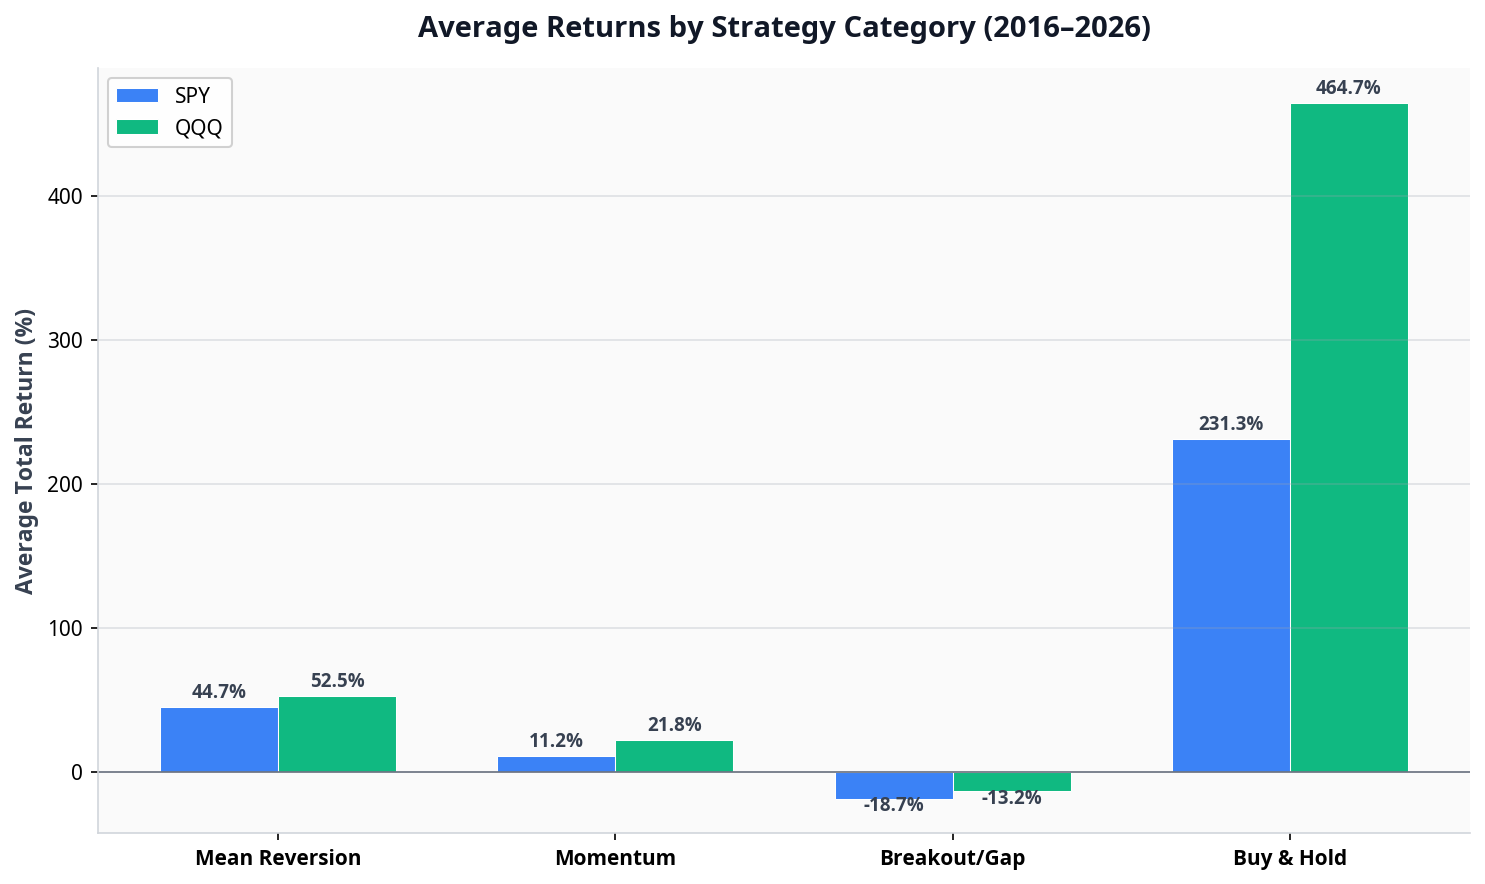
Mean reversion strategies were the clear winners. The RSI(2) and IBS strategies produced the highest returns, the best win rates (69–72%), and the strongest profit factors (1.6–2.25). These strategies exploit a well-documented market phenomenon: stocks that fall sharply in the short term tend to bounce back, especially when the broader trend remains bullish (price above the 200-day moving average).
Breakout and gap strategies lost money. The Opening Range Breakout — despite being validated in academic research when applied intraday with leverage — produced negative returns when approximated with daily data. The Gap Fill strategy also lost money, contradicting the popular belief that gaps “always fill.”
Nothing beat buy-and-hold. This is the most important finding. The best-performing strategy (IBS Mean Reversion on QQQ) returned +89.2% over 10 years. During the same period, simply buying and holding QQQ returned +464.7% — more than five times as much. Even the best active strategy captured only 19% of the passive return.
3. Why Mean Reversion Works (And Why It’s Still Not Enough)
The Structural Edge
Mean reversion strategies exploit a genuine market inefficiency. When stocks sell off sharply in the short term, several forces push prices back up: institutional rebalancing mandates force funds to buy fallen positions, short sellers cover their positions (creating buying pressure), and retail panic selling creates temporary dislocations from fair value. The 200-day SMA filter ensures trades are taken only in the direction of the prevailing long-term trend, avoiding the trap of buying into a genuine bear market.
The consistency of mean reversion across our tests is notable. All three mean reversion variants (RSI, IBS, and 3-Day Low) produced positive returns on both SPY and QQQ, with win rates between 59% and 72%. This is not a fluke — it reflects a persistent structural feature of equity markets.
Why It Still Falls Short
Low time-in-market. Mean reversion strategies are only invested during brief pullbacks, typically holding positions for 1–5 days. Over 10 years, these strategies might be in the market for only 10–15% of trading days. During the remaining 85–90% of the time, the capital sits idle while the market continues its long-term upward drift. Buy-and-hold captures 100% of the market’s upside.
Transaction costs erode returns. Our backtest did not include commissions, slippage, or the bid-ask spread. In practice, these costs would reduce the already modest per-trade returns (0.2–0.6% average) by a meaningful amount. Short-term capital gains taxes (10–37% in the U.S.) further diminish the advantage compared to long-term buy-and-hold, which benefits from lower tax rates.
Psychological difficulty. Even with a 70% win rate, a mean reversion trader will experience losing streaks. A streak of 5+ consecutive losses has approximately a 0.24% chance per sequence at a 70% win rate — but across hundreds of trades, it becomes near-certain. The maximum drawdowns of 9–18% in our backtest would test the discipline of even experienced traders.
4. The Hidden Costs Nobody Talks About
The academic literature identifies several costs that most aspiring day traders dramatically underestimate:
| Cost Category | Estimated Impact | Notes |
|---|---|---|
| Bid-ask spread | 0.1–0.5% per round trip | Varies by instrument; wider for less liquid assets |
| Slippage | 0.1–0.3% per trade | Market orders rarely fill at the quoted price |
| Short-term capital gains tax | 10–37% of profits | Versus 0–20% for long-term holds |
| Opportunity cost of time | $30,000–$45,000/year | Based on 4–6 hours daily at $30/hour alternative wage |
| Platform/data fees | $1,200–$6,000/year | Real-time data, charting software, execution platforms |
| Psychological cost | Unquantifiable | Stress, sleep disruption, relationship strain |
When all costs are included, a day trader needs to generate roughly 15–25% annual returns just to break even compared to a passive investor who spends zero time on their portfolio. Our best-performing strategy (IBS Mean Reversion on QQQ) generated approximately 6.6% annualized — well below this hurdle rate when fully loaded costs are considered.
5. Who Actually Makes Money Day Trading?
Algorithmic and systematic traders. The Zarattini and Aziz studies demonstrate that fully systematic strategies, executed without discretion, can generate significant alpha. These traders use coded algorithms, rigorous backtesting, and automated execution. They do not make decisions based on intuition or “feel.”
High-frequency trading firms. Firms like Citadel Securities, Virtu Financial, and Jump Trading consistently profit from intraday trading, but they operate with microsecond execution speeds, co-located servers, and teams of PhD-level quantitative researchers. Individual retail traders cannot compete on this playing field.
The persistent top 1%. The Taiwan study found that a small minority of day traders (less than 1%) did earn consistent profits over 15 years. These individuals demonstrated genuine skill that persisted across time periods. However, there is no reliable way to identify whether you belong to this group before committing years and significant capital.
6. The Verdict: A Nuanced Answer
What Works
Mean reversion strategies on major equity indices are the most consistently profitable short-term approach. Specifically, buying short-term dips in SPY or QQQ when the long-term trend is bullish has produced positive returns across multiple studies and our own backtest.
Systematic, rules-based execution is essential. Every piece of evidence — academic and empirical — points to the same conclusion: discretionary trading (making decisions based on judgment in the moment) dramatically underperforms systematic trading (following a pre-defined set of rules mechanically). The moment human emotion enters the equation, performance degrades.
What Doesn’t Work
Breakout strategies on daily timeframes lost money in our tests. The ORB strategy, while validated academically on intraday data with leverage, did not translate to daily-resolution trading. Gap fill strategies also failed to produce positive returns.
Discretionary day trading, as practiced by most retail participants, is a losing proposition. The academic evidence is overwhelming: 80–97% of retail day traders lose money across every market studied.
The Uncomfortable Truth
Even the best short-term strategy we tested (IBS Mean Reversion on QQQ, +89% over 10 years) returned less than one-fifth of what a simple buy-and-hold approach delivered (+465% over the same period). The active trader works harder, pays more in taxes and fees, endures significant psychological stress, and ends up with dramatically less money.
The data does not support the narrative promoted by trading educators, YouTube influencers, and brokerage platforms that day trading is a viable path to wealth for most people. For the vast majority of investors, the optimal strategy remains the simplest one: buy a diversified index fund, hold it for decades, and spend your time on activities with a higher expected return on effort.
If You Still Want to Trade
For those who understand the odds and still wish to pursue short-term trading, the evidence suggests the following principles maximize your probability of success:
- Use only systematic, rules-based strategies that have been backtested across multiple market regimes.
- Focus on mean reversion in equities, which has the strongest empirical support.
- Always trade with a long-term trend filter (e.g., 200-day SMA) to avoid catching falling knives in bear markets.
- Keep position sizes small and never risk more than 1–2% of capital per trade.
- Track every trade meticulously and compare your actual results to your backtest expectations.
- Accept that you will almost certainly underperform buy-and-hold and trade only if the intellectual challenge and engagement justify the opportunity cost.
References
[1] Barber, Lee, Liu, Odean — The Cross-Section of Speculator Skill: Evidence from Day Trading
[2] Barber, Lee, Liu, Odean — Do Individual Day Traders Make Money? Evidence from Taiwan (1992–2006)
[3] Faisal Haroon — I Reviewed Every Major Day Trading Study from the Last 25 Years (2025)
[4] Investopedia — Is Day Trading Profitable?
[5] Zarattini & Aziz — Can Day Trading Really Be Profitable? ORB Strategy (2023)
[6] Zarattini & Aziz — VWAP: The Holy Grail for Day Trading Systems (2023)
[7] Quantified Strategies — Mean Reversion Trading Strategies